


For seven years, I was the person everyone came to for data at JBCN. Data has always mattered here, but our old reporting systems weren’t designed for what we needed. So as the IGCSE coordinator, I built an entire analysis framework on spreadsheets. Tracking performance across grades, predicting trends, benchmarking to curriculum standards. We did all of it manually and it worked well, but the approach was largely dependent on me.
A system built around one person moves only as fast as that person can. When teachers had questions about their data, they had to wait for me to pull answers together. Coordinators wanted to explore trends but couldn’t access the analysis in their own time. And when decisions needed to be made quickly, the data often arrived one step too late.
This year, I stepped into a new position as Deputy Principal of Secondary, overseeing grades 6 through 12. The old data methods were still there, but they needed someone new to learn and run them. What I really wanted was for every teacher and coordinator to explore data on their own terms, draw their own conclusions, and use those insights to change what happens in their classrooms.
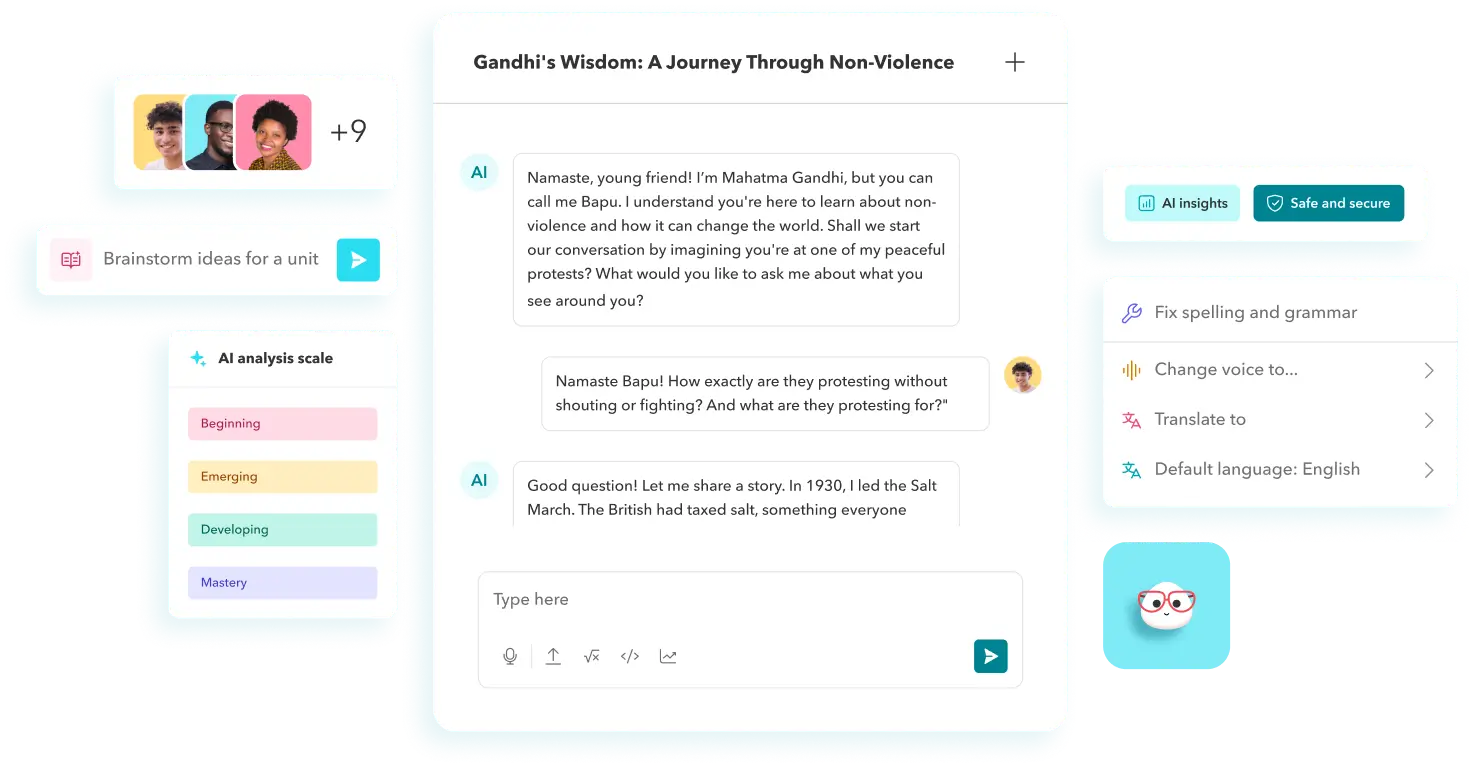
That’s where Toddle’s AI Insights came in.
We sat with AI Insights for a few minutes and came away with ideas for a stronger programme
Before Toddle, our reporting system gave us scores and pass rates but it couldn’t always help us understand what those numbers meant in context. The work of interpreting data, cross-referencing results, spotting patterns, thinking about where things were heading, all of that lived in my head and my spreadsheets.
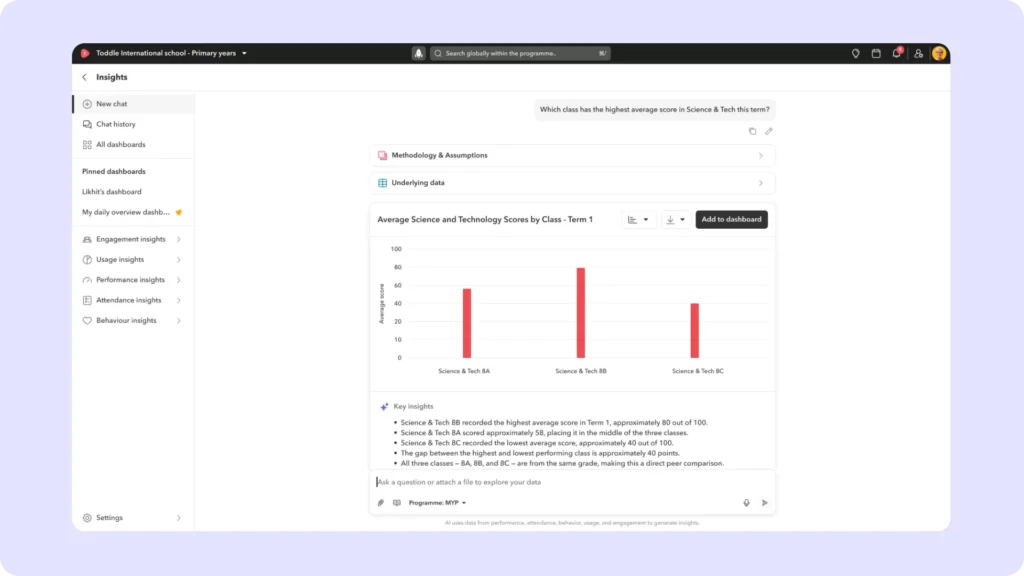
The first time my teachers and I opened Performance Insights together, we were genuinely surprised.
We started with a simple question. How are learners performing across subjects? The AI asked a few clarifying follow-ups and within minutes it presented a comprehensive analysis that would have taken me hours to put together. It showed us which subjects were performing well in our middle school, which ones had room to grow, and also flagged which subjects were at risk of declining further, based on low engagement in Grades 6, 7, and 8. No tool I’ve used has ever offered that kind of forward-looking perspective on its own.
From that single conversation with our data, we noticed there were a few subjects where we could be doing more. Not just in results but in the kind of meaningful engagement we were creating for learners. We revisited how we planned the curriculum and how we assessed learners in those subjects. That’s an intervention that came directly from what Toddle showed us.
The shift has been visible in the classroom. Learners in those classes are more engaged, the lessons are more interactive, and the assessments feel more aligned to how they actually learn.
And the part that mattered most to me is that it didn’t come from one person analysing data on their own for hours. It came from our teachers and me sitting with our data together, talking through it in a way that felt natural to us as educators. Soon enough they won’t need me in the room at all. That’s exactly where I want us to be.
Access to better data has changed how we grow together as a team
One of the things I value most about AI Insights is how it helps me support my teachers’ growth.
At JBCN, we run subject bands. For example, seventy learners in Grade 9 Chemistry are split across three teachers, each with a mixed-ability group. With AI Insights, I can now get a quick, thorough picture of each teacher’s data. I can see their engagement levels, their learners’ outcomes, how they compare across bands, and more, and that gives me clear visibility into how to help strengthen their practice.
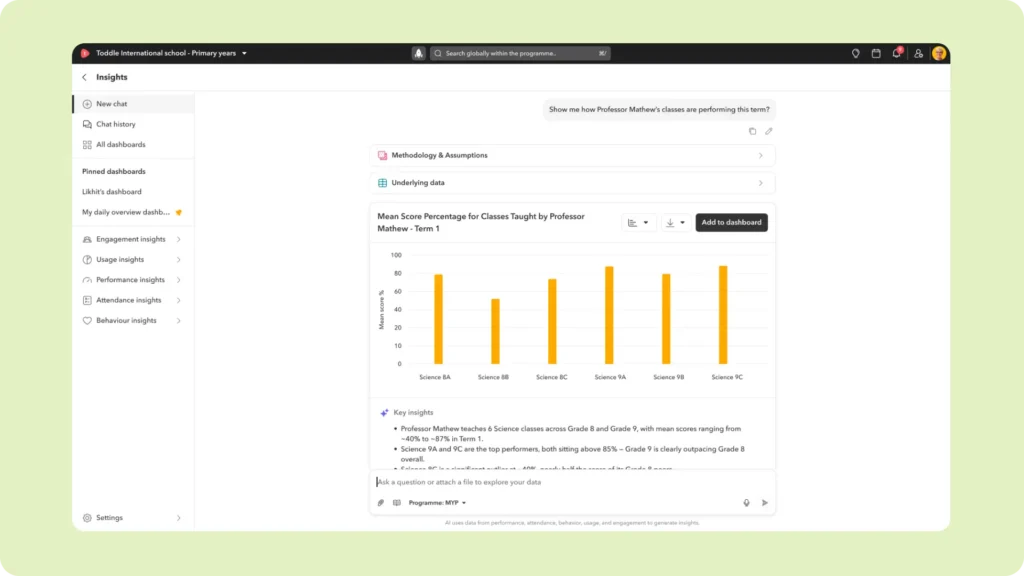
The cherry on top is that our teachers also have access to the same data I do. So when I sit down with a teacher, it’s no longer a top-down judgement. It becomes: okay, this is what both of us are seeing, what do we do next? The conversations are much more constructive. Teachers aren’t hearing my interpretation of their performance. We’re both looking at the same evidence and co-constructing their PD sessions, together.
I’ve seen teachers leave these conversations and immediately restructure how they approach a topic in their next unit. The data doesn’t just inform a conversation, it changes what happens in the classroom.
I walk into strategic meetings as a more confident leader
Any school leader will tell you that preparing for strategic meetings is one of the most demanding parts of the job. Decision-makers often want the big picture across 1000+ learners and 200+ staff members. For us, that’s always meant combing through data from multiple sources. I’ve spent days, at minimum, assembling that kind of summary. With Toddle’ AI Insights, I was prepared in an hour.
Toddle gave me a ready-made analysis that covered top-performing and underperforming subjects, associated risks, and recommended interventions. It drew from both performance results and assessment frequency data across departments.
When I presented this at our meeting, I felt more confident than ever. I had solid, well-organized data behind every point, and it showed.
Data belongs to everyone at JBCN now
The challenge with everything I’d built before was that I had to lead the system. Because the system depended on me maintaining everything, teachers naturally defaulted to my way of looking at data. The analysis was never ready for them to explore independently. If I left the role, the institutional knowledge would leave with me.
With Toddle, our data now works for everyone.
Coordinators check insights on their own. Teachers can see how their classes are performing. No one is building pivot tables across multiple spreadsheets anymore – you ask a question and get an answer in seconds. The data is system-driven, not person-driven, and that’s a shift we’ve been trying to make for years.